As one of Vietnam’s top 10 software development companies since 2009, we have empowered our global partners with innovative digital and talented professionals.
Your Trusted Software
Development Partner
Featured Partners
As the first and only member of Apple Consultants Network in Vietnam, we’ve also partnered with other global leaders
15+
15+
Years
700+
700+
Employees
200+
200+
Happy Clients
500+
500+
Projects
Why You Should Choose Us
Differentiating ourselves from other software development firms through years of experience and deep expertise, we guarantee an exceptional customer satisfaction and retention rate.

Enterprise
A long-term partner providing expertise in various domains and assembling dedicated teams of 50-100 members.
- Strategic Partnership – Tech Partners to enhance your Digital Transformation
- Oversea Delivery Center – BPO your IT Department in a competitive salary range, save at least 30% cost

SMEs
An expansion for your IT team to accelerate product innovation timelines, while also optimizing costs.
- IT Resources Reinforcement – Shorten & simplify your recruitment process in Software Development
- Product & Features add-on – Full Cycle Software Development for your Business

Start-up
A full team with startup experience and industry expertise, swiftly building your products.
- CTO & SA Services for Domain – BFSI, Healthcare, Logistic, Tourism & Hospitality, Retail & E-commerce
- Prototype/ MVP Development – Help accelerate your Start-up Business
OUR SOLUTIONS
Industry Expertise
Our Software Outsourcing Development & IT Outsourcing Team crafts premier solutions tailored to specific industries.

#01 BFSI
We develop digitized financial solutions, encompassing personal finance management, trading platforms, e-wallets, and advanced banking software, to automate and revolutionize the finance sector.
- Banking apps
- Financial analytics
- Integration with third-party services
- Fraud protection
- Self-service portals
- Personal wallets
- Currency exchanges
- Trading platforms
- Wealth management apps

#02 IT
Launching a new project but facing a bottleneck with local team availability? Let our team of highly skilled developers bridge the gap. We tailor our team selection to your project’s specific needs, ensuring a blend of experience, expertise, and technical acumen that aligns with your business objectives. Partner with us to turn your vision into a successful product
- Backend Developers
- Frontend Developers
- Native & Cross-platform Mobile Engineers
- QA Specialists
- UX/UI Designers

#03 Heathcare
We craft IoT-enabled apps compliant with HIPAA regulations, including EHR, telehealth, vital monitoring, appointment scheduling, and e-prescriptions, enhancing healthcare accessibility and efficiency.
- Optimization of hospital activity
- Assistance in diagnosis
- Healthy living
- mHealth
- Reminders and alerts
- Healthcare provider management
- Information portals
- Data analytics
- Supply chain management

#04 Education
We aim to enhance learning efficiency and reduce costs through eLearning development, creating solutions like LMS, LCMS, and LXP. Our services span from consulting on eLearning implementation, designing and coding solutions, modernizing legacy systems, to customizing and integrating existing platforms.
- Learning management systems
- eLearning portals
- Learning experience platforms
- Remote proctoring software
- Learning content management systems
- Mobile learning solutions
- Knowledge management solutions

#05 E-Commerce
Our software development expertise lies in crafting intricate marketplaces, online shopping platforms, and sites equipped with cutting-edge payment methods, reinventing the e-commerce landscape.
- Dropshipping e-commerce apps
- Crowdfunding platforms
- Service-based e-tailer platforms
- Online storefronts
- Online marketplaces
- M-commerce
- Wholesale and warehouse online catalogs
- Private label manufacturing software
- White label software
- Subscription services

#06 Retail
Leveraging our expertise, we design intricate, on-demand delivery software systems operating in big cities, driving efficiency in logistics and goods movement.
- On-demand food delivery applications
- Transportation and logistics apps
- Taxi services
- House cleaning and handyman apps
- Car rental services
- Flower and gift delivery apps

#07 Manufacture
We design IT solutions for manufacturers to boost productivity, extend asset longevity, cut operational costs, and mitigate risks, thereby revolutionizing business-critical operations for enhanced efficiency.
- ERP solutions
- Business intelligence solutions
- Manufacturing data analytics solutions
- Data warehouse solutions
- HR solutions
- Project management solutions
- Document management solutions
- Intranet solutions
Seeking tech expertise to save IT costs?
OUR SERVICES
Our Products & Services
Our experienced software development team, along with efficient processes, delivers deployment of various specialized services.

Digital Platform
Services
- White label (E-Wallet, Timesh…)
- Cybersecurity
- AWS, Azure, Google Cloud
- AUTOSAR, ECU, MBD…
- Smart Factory Platform
- SAP ERP
- No/Low code
- JD Printing platform
- Bio/Neuralink

Advanced IT
Services
- AI & Machine Learning
- AR/VR
- Blockchain
- Cloud Computing
- Data Analytics/Big Data
- Internet Of Things
- Semiconductor
- Robotic Process Automation
- ChatGPT
- Bespoke Software Development Service

IT Outsourcing
Services
- IT Staff Augmentation
- Offshore Developers for Hire
- Dedicated Development Team
- Development Outsourcing Services
- Web Development Outsourcing
- DevOps Outsourcing
- Outsourced IT Support
- Software Testing and QA Outsourcing
- Offshore Software Development Center (ODC)
OUR TECHSTACKS
Pioneering Technologies
Our dedicated software development team is master of every trending language and framework.


Leading Software Development Companies in Vietnam
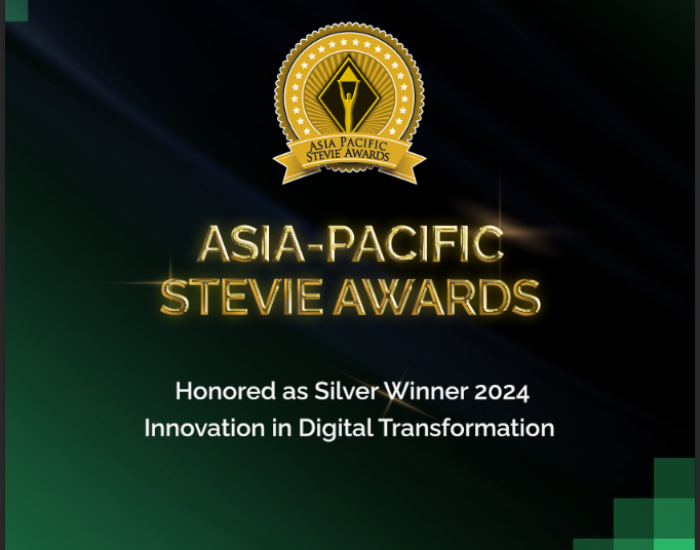
Our Achievements
Awards & Recognition


Featured in the Press


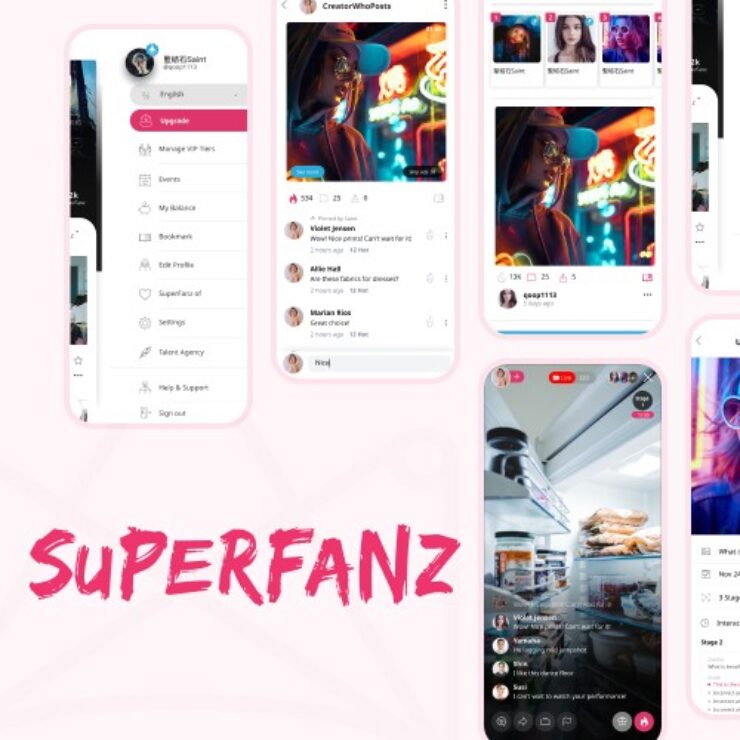
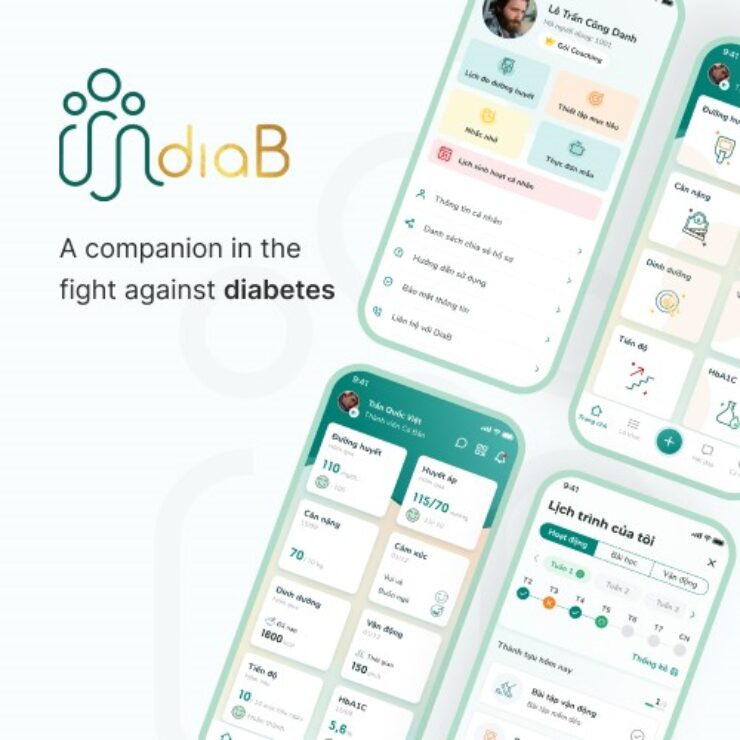
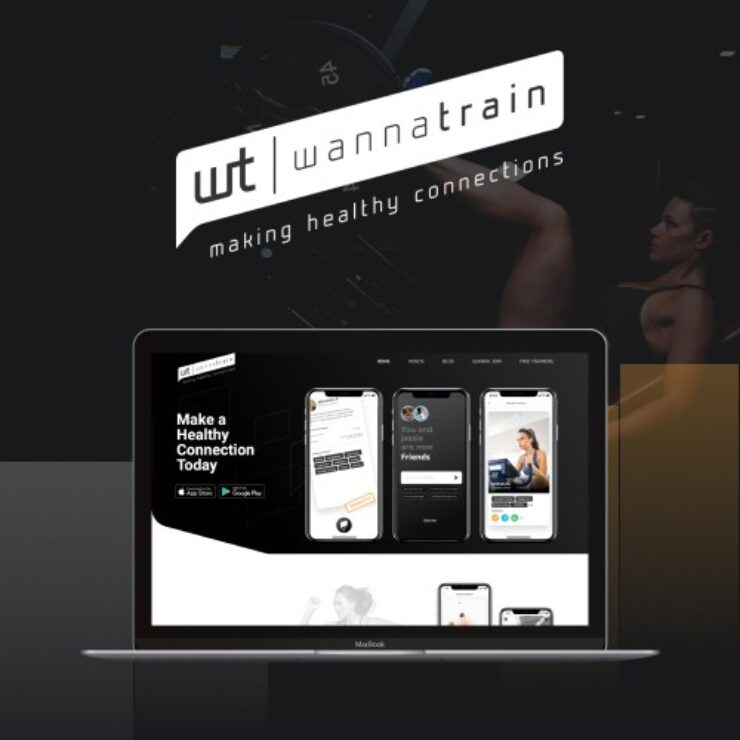
SUCCESS STORIES
Our Case Studies
Discover how our tailored solutions have driven impactful changes.


VOICE OF CLIENTS
Endorsements from Industry Leaders
We always strive to be Your trusted Tech Partner
When comparing Savvycom with big Enterprise in Vietnam, in terms of product quality and business communication, Savvycom is providing a very high standard compared to other firms in the market.

Kay Koo
Vice President, KG ICTThey were responsive to our communications along the project and delivered high-quality work on time and within budget. Savvycom team has been very reliable with their delivery promises.

Wesam Sarsour
Vice President, JK MovingSavvycom has the ability and resources to support all the transformation initiatives within the Middle East and African banking sector.

Hani Gosim
Managing Director, Khotawat ConsultancySavvycom has transcended typical vendor engagement, merging seamlessly with Jio. The boundary where Savvycom begins and Jio ends is virtually invisible. It's been an extraordinary experience!

Raghu Rai
CEO, Jio HealthOur app, rated #1 on local app stores with no negative comments, is a testament to Savvycom's quality. I am thrilled with the product and plan to continue our collaboration for updates and new features.

Nikias Leigh
CEO, Real Property PhotographySavvycom's team, committed to long-term success, is transparent and prioritizes continual improvement, adeptly balancing speed and quality in a dynamic landscape. Their dedication is unmatched.

David Cheng
Founder, iHeartlocalCOMPANY NEWS & INSIGHTS
Latest from Savvycom


FAQ about Savvycom – Top Software Outsourcing Company in Vietnam

What is IT Outsourcing?
IT outsourcing (information technology outsourcing) involves engaging external service providers to deliver IT-enabled business processes, application services, and infrastructure solutions that drive tangible business results. According to Statista:
- In 2023, IT Outsourcing market's revenue will be $460.10bn.
- An annual growth rate of 11.07% is projected from 2023 to 2028, leading to a market volume of $777.70bn by 2028.
- The average IT Outsourcing spend per employee is estimated to be $132.10 in 2023.
- The United States will generate the highest revenue globally, with a projected $167.90bn in 2023.
Savvycom is a Software Development, IT Outsourcing Company in Vietnam specialized in delivering tailor-made it solutions helping businesses in BFSI, Healthcare, E-commerce and other sectors to cut costs and concentrate on their core operations. Our expertise supports Enterprises and SMEs in harnessing technology for growth and efficiency.
Why Companies Outsource IT Services?
Yes, by working with an IT Outsourcing Company or simply using IT Outsourcing Services can be a beneficial approach for many businesses. Here's why:
- Cost Efficiency: Outsourcing can often be more cost-effective than maintaining an in-house team, particularly for small to medium-sized businesses or startups.
- Access to Expertise: You can get access to a large pool of talented developers and specialists who are up-to-date with the latest technologies and trends.
- Flexibility: Outsourcing allows for scaling your team size up or down based on project requirements, without the long-term commitments of hiring full-time staff.
- Focus on Core Business: Outsourcing technical tasks allows your in-house team to focus on the core business aspects.
- Complex Projects: Successfully navigating a complex project demands significant technical expertise and know-how. Lacking these, one can quickly encounter obstacles and experience costly delays.
How Much Does IT Outsourcing Cost?
The cost of IT outsourcing can vary significantly based on the scope of work, the expertise required, and the pricing model adopted. Two common pricing models include team-based pricing and fixed-cost pricing. Regarding IT outsourcing models and project estimation:
- Dedicated Team Model: A long-term partnership where the outsourcing company provides a dedicated team to work exclusively on your projects. This model is beneficial for large projects with evolving requirements.
- Fixed Price Model: The project scope and timeline are well-defined, and the outsourcing company delivers the project for a fixed price. This model is suitable for small-to-midsize projects with clear specifications.
- Time and Material Model: This model provides the greatest flexibility, as you pay for actual work hours spent on the project. This model is ideal for projects where requirements may change frequently.
Project estimation in outsourcing involves determining the time and resources required for the project. It includes assessing the project size, complexity, and potential risks. Accurate project estimation is crucial for setting realistic deadlines and budgets.
Common Factors Affecting The Costs Of IT Outsourcing & Software Development
The software's scale significantly influences its development cost, whether produced in-house or outsourced. The scale varies based on the needs of an organization and its user base.
- Small Scale: This involves crafting straightforward software with minimal custom coding requirements.
- Mid Scale: This pertains to the development of Minimum Viable Products (MVPs) featuring a singular functionality in its simplest form.
- Large Scale: This entails the creation of comprehensive software, featuring a myriad of functionalities, API integrations, and database components.
- Enterprise Scale: This refers to the generation of internal or customer-facing applications designed for enterprises servicing tens of thousands of users, with a focus on delivering an outstanding user experience.
How do you choose the right IT service provider to outsource to?
When selecting an IT service provider for outsourcing, prioritize their expertise in outsourced IT development and their ability to meet your technical requirements. Assess their track record in delivering quality services and their flexibility to scale resources as needed. Ensure effective communication channels and robust security measures are in place. Finally, evaluate the overall value they offer in relation to cost.
What Are The 07 Steps Of Software Development Life Cycles?
Partner with Savvycom to elevate and streamline each phase of your SDLC:
- Planning: Savvycom strategizes with you, defining clear objectives aligned with your vision.
- Analysis: Our team conducts thorough requirements analysis, ensuring feasibility and optimal solutions.
- Design: Savvycom's expert designers create intuitive and aesthetically pleasing software structures.
- Development: Our developers, proficient in the latest technologies, construct robust software.
- Testing: Savvycom's rigorous testing processes verify functionality and identify potential issues.
- Implementation: We ensure smooth deployment of your software, minimizing disruption.
- Maintenance: Savvycom provides regular updates and troubleshooting, ensuring your software remains efficient and effective.
Outsourcing Or In-house? Which One Is Better For You?
Choosing between outsourcing to an IT service company and in-house teams depends on several factors:
- Budget: If budget is tight, outsourcing can be more cost-effective.
- Expertise: Need specific expertise not in your team? Outsourcing may be better.
- Control: Want direct control over staff? In-house could be preferable.
- Scalability: For rapid scaling, outsourcing often provides faster solutions.
- Project Nature: Routine tasks can be outsourced while core functions often stay in-house.
Does Savvycom Provide Dedicated Development Team?
A dedicated development team is a model where an outsourcing company provides a team that works exclusively on your project. They act as an extension of your in-house team. Benefits of this model include:
- Focus: The team is entirely dedicated to your project.
- Flexibility: It's easier to manage changes in project requirements.
- Cost Efficiency: You get a full team without the overhead of hiring in-house.
Looking for a top-notch dedicated development team? Savvycom offers excellent value, providing high-quality dedicated development teams at attractive prices.
Nearshore And Offshore Development At Savvycom
Offshore Software Development is when you outsource work to a company in a different country, usually one with a significantly different time zone. Benefits include:
- Cost Efficiency: Lower operational and labor costs.
- Access to Global Talent: Bigger pool of skilled developers.
Nearshore Software Development is outsourcing to a company in a nearby country, often in the same or a similar time zone. Benefits include:
- Cultural Similarity & Time Zone: Easier collaboration and communication.
- Quality Work at Competitive Prices: High value for investment.
Savvycom, with robust capabilities and a global presence, is the perfect partner to scale your business, both nearshore and offshore. Get in touch today to kickstart your journey to success.