What Is Supply Chain Visualization: Critical Insights for Enhanced Operational Excellence
In today’s complex global marketplace, supply chain visualization is emerging as a game changer for companies striving to optimize operations and mitigate risks. With increasing complexity in global supply networks and heightened customer expectations, businesses in BFSI, healthcare, education, retail, and manufacturing must harness the power of advanced visualization tools to drive efficiency and innovation. Supply chain visualization transforms raw, fragmented data into clear, actionable insights, enabling leaders to monitor performance in real time and make data-driven decisions. This article provides a critical, data-driven analysis of supply chain visualization, exploring its key features, benefits, real-world case studies, and future trends to help you make informed decisions for your business.
For organizations ready to harness the power of digital transformation and optimize their supply chain processes, investing in robust supply chain visualization solutions is a strategic imperative. Savvycom, a leading software development company, offers comprehensive, custom IT solutions that integrate cutting-edge supply chain visualization technologies. Our expertise in custom software development services ensures that your supply chain remains agile, secure, and continuously optimized for maximum efficiency.
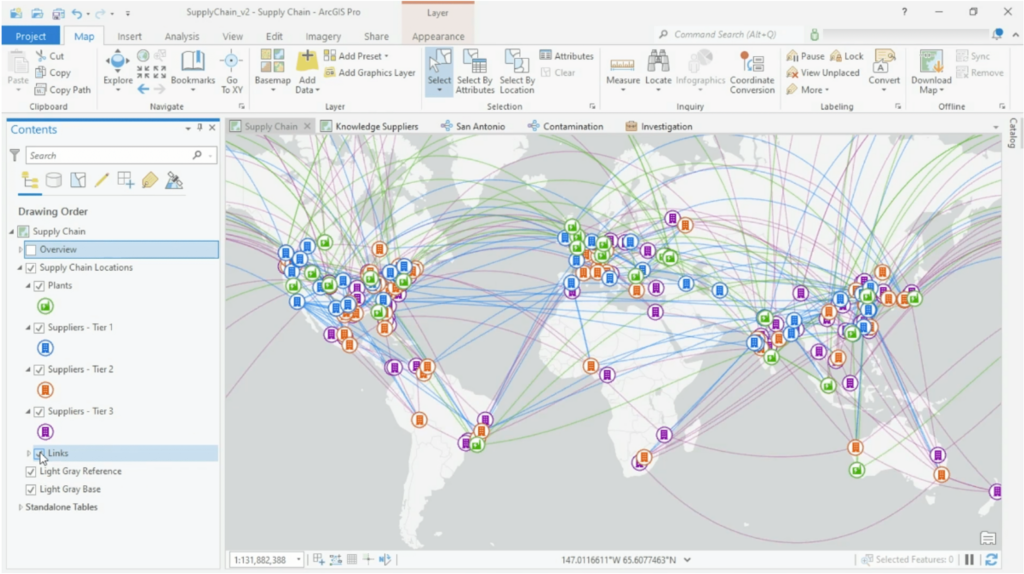
Source: Esri
Understanding Supply Chain Visualization
Supply chain visualization refers to the graphical representation of data from every stage of a supply chain, from procurement and production to distribution and logistics. It integrates disparate data sources into a unified digital dashboard, allowing businesses to gain a holistic view of their supply chain performance. By converting complex data into intuitive charts, graphs, and heat maps, visualization tools empower organizations to identify bottlenecks, track key performance indicators (KPIs), and forecast trends.
At its core, supply chain visualization is about turning vast volumes of raw data into meaningful insights that drive continuous improvement. For example, by visualizing inventory levels across multiple locations, a company can optimize stock allocation and reduce carrying costs, a critical factor in today’s lean manufacturing environments.
Who Actually Needs Supply Chain Diagrams
It’s easy to assume that supply chain visualization is a luxury reserved for multinational logistics giants or high-tech manufacturing behemoths. But that assumption is outdated, and costly.
In reality, any business with suppliers, inventories, deliveries, or compliance requirements can benefit from supply chain diagrams. That includes healthcare networks tracking critical pharmaceuticals, retailers trying to avoid stockouts during peak seasons, and even education institutions managing distributed procurement for campuses.
What matters is this: the more moving parts in your operations, the more dangerous it is to fly blind.
-
A retail chain without a visual of its warehouse-to-store flow will struggle with overstock and missed sales.
-
A BFSI firm without mapped vendor dependencies is one compliance failure away from reputational damage.
-
A healthcare system without supply visibility risks delivery delays that could literally cost lives.
Small and mid-sized enterprises (SMEs) are especially vulnerable because they tend to run lean. One hiccup in a single supply node can ripple across the entire business.
This is why system integrators and digital consultants increasingly recommend even basic visual mapping tools to clients, not for sophistication, but for resilience. A clear diagram can expose inefficiencies that spreadsheets will hide for months.
Key Features of Supply Chain Visualization
Real-Time Data Integration
A standout feature of supply chain visualization is its ability to aggregate and display data in real time. This real-time integration means that every stage of the supply chain, from raw material procurement to finished product distribution, can be monitored continuously. Real-time dashboards provide instant visibility into metrics such as inventory turnover, delivery times, and production cycle times. This immediacy is critical for detecting anomalies and implementing rapid corrective measures.
- Example: A global electronics manufacturer integrated real-time dashboards with its supply chain data, resulting in a 20% improvement in inventory turnover and a 15% reduction in stockouts (Forrester).
Interactive Dashboards and Customizable Reporting
Modern supply chain visualization tools feature interactive dashboards that can be tailored to the needs of various stakeholders. Customizable reports enable users to drill down into specific data points, analyze trends, and monitor KPIs effectively. These dynamic interfaces ensure that complex data is presented in an easily digestible format, fostering better decision-making across all levels of the organization.
- Insight: Interactive dashboards not only facilitate real-time monitoring but also encourage proactive management, which is essential for continuous process improvement and agile response to market changes.
Predictive Analytics and Forecasting
Integrating predictive analytics into supply chain visualization allows organizations to anticipate future disruptions and opportunities. Advanced algorithms can analyze historical data and current trends to forecast demand, predict equipment failures, or identify potential delays. This foresight enables companies to take proactive measures, thereby reducing risks and ensuring smooth operations.
- Data Point: McKinsey & Company reports that predictive analytics in supply chain management can improve forecasting accuracy by up to 30%, leading to better resource allocation and reduced costs (McKinsey).
Enhanced Security and Data Governance
Given the critical nature of supply chain data, security is paramount. Effective supply chain visualization tools incorporate advanced encryption, role-based access control, and real-time monitoring to ensure data integrity and protect against cyber threats. Ensuring robust data governance not only secures sensitive information but also supports compliance with regulatory standards such as GDPR and HIPAA.
- Statistic: According to the Ponemon Institute, organizations that implement advanced data governance and security measures experience up to 50% fewer data breaches (Vorecol).
Scalability and Flexibility
Scalability is essential for adapting to growth and fluctuating market demands. Supply chain visualization systems are designed to scale seamlessly, accommodating increased data volumes and additional nodes as your business expands. Cloud-based solutions, in particular, offer unparalleled flexibility, allowing businesses to adjust resources in real time without incurring heavy upfront capital expenditures.
- Reference: Gartner predicts that scalable cloud solutions in supply chain management can reduce overall IT costs by up to 20% while improving agility (Gartner).
Looking For a Trusted Tech Partner?
We’ll help you decide on next steps, explain how the development process is organized, and provide you with a free project estimate.
Benefits of Supply Chain Visualization
Enhanced Operational Transparency
One of the primary benefits of supply chain visualization is the unprecedented level of transparency it provides. By consolidating data from multiple sources, businesses gain a comprehensive view of their operations, enabling them to identify inefficiencies and optimize processes. Enhanced transparency drives accountability and allows for real-time adjustments that can significantly boost operational performance.
Improved Decision Making
With real-time analytics and interactive dashboards, supply chain visualization empowers decision-makers with accurate, actionable insights. Data-driven decision-making facilitates faster response times, minimizes risks, and enhances strategic planning. When leaders have access to clear, concise information, they can allocate resources more effectively and implement changes that drive long-term improvements.
Cost Reduction and Increased ROI
By optimizing inventory management, reducing production bottlenecks, and minimizing waste, supply chain visualization contributes directly to cost savings. Companies that implement these systems often experience a reduction in operational expenses ranging from 15% to 25%, leading to a significant return on investment. These savings are particularly critical in industries with tight margins, where every dollar counts.
Enhanced Risk Management
Risk management is a vital component of modern supply chains. Supply chain visualization provides early warning signals for potential disruptions, whether due to supplier delays, transportation issues, or sudden shifts in market demand. Proactive risk management enabled by visualization tools allows organizations to mitigate risks before they escalate, safeguarding both revenue and reputation.
Improved Customer Satisfaction
A well-optimized supply chain directly impacts customer satisfaction. By ensuring timely deliveries, maintaining consistent quality, and reducing errors, companies can enhance the overall customer experience. Visualized data allows businesses to pinpoint and address issues quickly, ensuring that customer expectations are consistently met.
Real-World Case Studies: Transformative Impact of Supply Chain Visualization
Case Study 1: Automotive Manufacturing Optimization
Background:
A major automotive manufacturer struggled with production disruptions and equipment downtime, impacting its overall productivity and increasing operational costs.
Solution:
The manufacturer implemented an advanced supply chain visualization system that integrated data from production lines, suppliers, and logistics partners. Using real-time dashboards and predictive analytics, the company was able to monitor performance continuously and proactively address issues.
Results:
- 30% reduction in unplanned downtime.
- 25% improvement in production yield.
- Maintenance costs decreased by 20% over the long term.
This case study demonstrates that the benefits of supply chain visualization, despite the associated costs, significantly outweigh the initial investment by boosting operational efficiency and reducing overall costs.
Case Study 2: Retail Supply Chain Transformation
Background:
A leading retail chain was grappling with inventory mismanagement, leading to frequent stockouts and overstock situations that hurt sales and customer satisfaction.
Solution:
The retailer deployed a comprehensive supply chain visualization platform that consolidated data across all stores, warehouses, and distribution centers. The system used predictive analytics to forecast demand patterns and optimize inventory levels in real time.
Results:
- 20% reduction in stockouts.
- 15% decrease in excess inventory.
- Customer satisfaction improved by 10% due to more reliable product availability.
By leveraging advanced visualization and predictive analytics, the retailer was able to optimize its inventory management process, directly translating to improved sales performance and a stronger competitive position.
Case Study 3: Healthcare Supply Chain Efficiency
Background:
A regional healthcare network faced significant challenges managing its supply chain for critical medical supplies and pharmaceuticals, leading to delays and increased costs.
Solution:
The network implemented a cloud-based supply chain visualization solution that integrated data from suppliers, warehouses, and distribution channels. Real-time monitoring and automated alerts enabled the network to optimize inventory and reduce delays.
Results:
- 25% reduction in supply chain delays.
- 20% improvement in inventory accuracy.
- Operational costs were reduced by 15%, leading to better patient care and regulatory compliance.
This case highlights how effective supply chain visualization can streamline operations in healthcare, ensuring that critical supplies are managed efficiently and delivered on time.
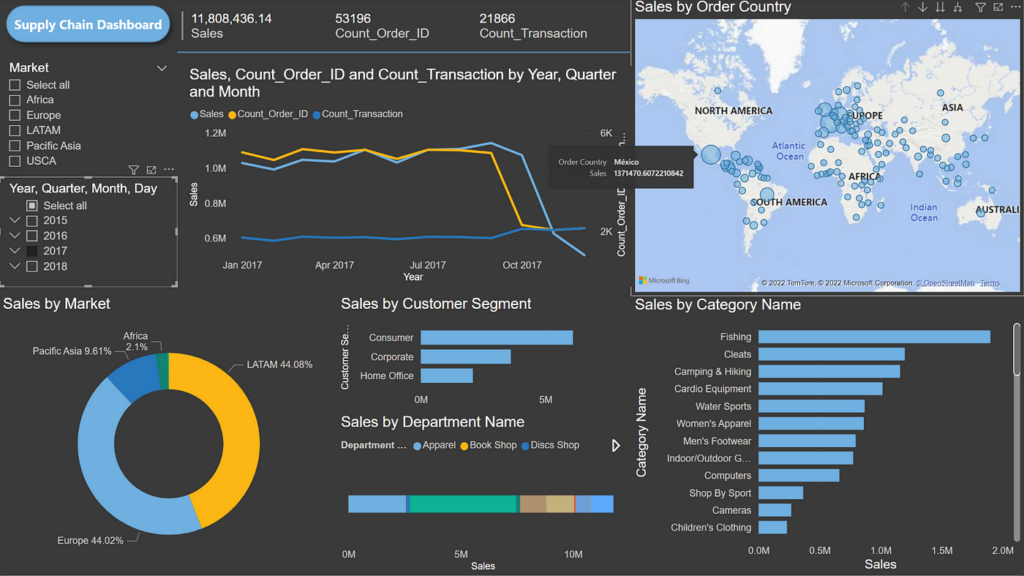
Source: Yannawut Kimnaruk
Future Trends in Supply Chain Visualization
1. AI-Driven Predictive Analytics
The integration of AI and machine learning will further enhance supply chain visualization by enabling predictive analytics. These technologies will analyze vast datasets to forecast disruptions, optimize inventory, and drive proactive decision-making. McKinsey research indicates that AI-powered supply chain solutions can improve forecasting accuracy by up to 30%.
2. Expansion of Cloud-Based and Edge Computing Solutions
Cloud and edge computing will play critical roles in the evolution of supply chain visualization. Cloud platforms offer scalability and real-time data processing, while edge computing reduces latency by processing data closer to the source. This combination will result in more responsive and cost-effective supply chain management systems, further lowering overall IT expenses.
3. Advanced Data Visualization and User-Centric Design
Next-generation visualization tools will leverage interactive dashboards and sophisticated data visualization techniques to present complex data in an intuitive manner. Enhanced user-centric design will empower stakeholders to quickly identify trends, spot anomalies, and make informed decisions. This will foster a culture of continuous improvement and agile response across the supply chain.
4. Strengthened Cybersecurity and Data Privacy
As cyber threats become more sophisticated, the security of supply chain data will be paramount. Future solutions will incorporate advanced cybersecurity measures, such as end-to-end encryption and continuous threat monitoring, to protect sensitive data and ensure compliance with global standards like GDPR and HIPAA. The Ponemon Institute reports that advanced security measures can reduce data breaches.
5. Greater Standardization and Interoperability
Efforts to standardize communication protocols and improve interoperability among different supply chain systems will further enhance the effectiveness of supply chain visualization. This will simplify system integration, reduce complexity, and drive down costs while providing a unified view of operations across the entire supply chain.
Some Simpler Tools Might Be Smarter for Supply Chain Visualization
Here’s a critical truth most vendors won’t admit: You don’t always need a million-dollar platform to understand your supply chain.
In fact, for many growing businesses, overengineering the solution can be just as harmful as having none. What you need is visibility, not complexity.
Platforms like Tableau, Power BI, or even Google Looker Studio can offer real-time dashboards and simple visuals using your existing Excel or ERP data. These tools help highlight issues like:
-
Repetitive late deliveries from a single vendor.
-
Inconsistent inventory levels across regions.
-
Delays at handoff points between manufacturing and logistics.
Need something more collaborative? Tools like Lucidchart or Miro make it easy for cross-functional teams to draft supply diagrams that everyone can understand – without a 10-week onboarding period.
The key takeaway here: Clarity beats complexity. Many businesses delay adopting supply chain visualization because they assume it needs to be fully automated, deeply integrated, and high-cost. In reality, the first wins come from simply making your supply chain visible.
FAQs
What are the key features of an effective supply chain visualization system?
Key features include real-time data integration, interactive dashboards, predictive analytics, scalability, robust security protocols, and seamless interoperability with existing ERP and MES systems. These features collectively ensure that the system delivers actionable insights for continuous improvement.
Can supply chain visualization systems be integrated with existing enterprise systems?
Yes. Modern supply chain visualization solutions are designed for seamless integration with legacy systems, ERP, MES, and cloud platforms, creating a unified digital ecosystem that enhances data accuracy and operational performance.
Conclusion
In the era of digital transformation, supply chain visualization is a critical tool that empowers organizations to transform raw data into actionable insights. By providing real-time visibility, enhancing decision-making, and enabling proactive management, these solutions drive significant improvements in operational efficiency, cost reduction, and risk management.
The future of supply chain management will rely on advanced technologies such as AI, cloud computing, and predictive analytics to further enhance visibility and streamline operations. Although implementing sophisticated visualization systems may involve a significant upfront investment, the long-term benefits, including improved productivity, enhanced customer satisfaction, and a stronger competitive edge, justify the cost.
Tech Consulting, End-to-End Product Development, Cloud & DevOps Service! Since 2009, Savvycom has been harnessing digital technologies for the benefit of businesses, mid and large enterprises, and startups across the variety of industries. We can help you to build high-quality software solutions and products as well as deliver a wide range of related professional services.
Savvycom is right where you need. Contact us now for further consultation:
- Phone: +84 24 3202 9222
- Hotline: +1 408 663 8600 (US); +612 8006 1349 (AUS); +84 32 675 2886 (VN)
- Email: [email protected]